GraphPlotter
This project/repository contains programs for plotting graphs of various functions including polynomial , trignometric , exponentiation and logarithmic functions using Turtle/Matplotlib along with Tkinter.


License
Brief
The following project had been initiated as an experimental project to test turtle’s feasibility in plotting 2D graphs of various types of functions. Project slowly transposed into a Graph Plotting Software which currently(in latest version) uses tkinker and matplotlib .
Note
- Written on python(3.x)
- CLI versions
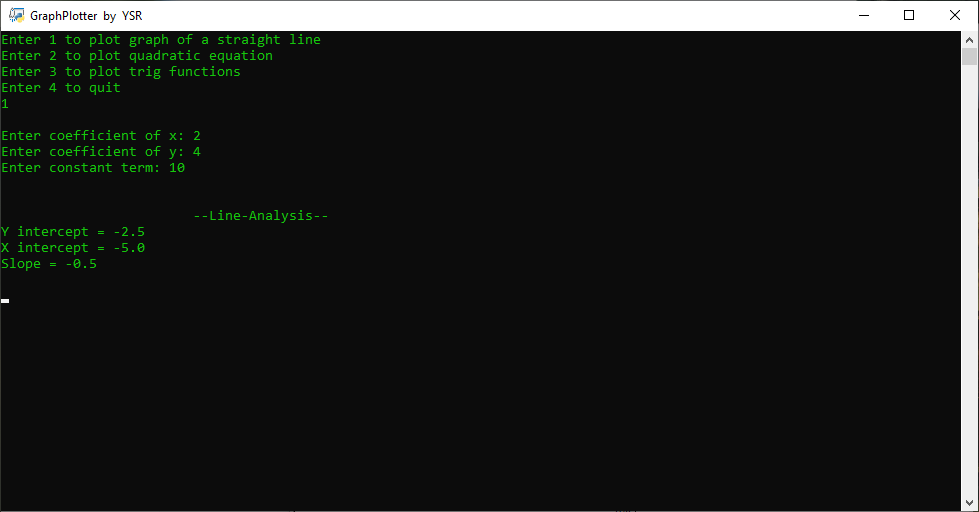
- GraphPlotterI
- GraphPlotterII
- GraphPlotterIII
- GUI versions
- GraphPlotterIV
- GraphPlotterV (Under Development!)
- Modules Required
- For CLI versions
- math
- os
- turtle
- For GUI versions
- math
- tkinter
- matplotlib
- For CLI versions
Versions
GraphPlotterI
- Most basic version
- For plotting straight line, quadratic functions and trignometric functions.
- Link: GraphPlotterI


GraphPlotterII
- For plotting straight line, polynomial functions and trignometric functions.
- Link: GraphPlotterII


GraphPlotterIII
- For plotting straight line, quadratic functions and trignometric functions.
- Two different graphing planes available.
- Help available.
- Verification password :
HeisenBerG - Link: GraphPlotterIII


GraphPlotterIV
- First GUI varient
- For plotting polynomial functions and trignometric functions.
- Link:
- Python File: GraphPlotterIV
- Executable File: GraphPlotterIV


GraphPlotterV
- [Under Development!!!]
- For plotting polynomial functions , trignometric functions , Bar Garphs and Pie Charts.
- Help section addressing FAQs.